Data Management Platform
Seamless low-/no-code data integration, template-driven data uniformization, and single source of truth for stored OT data
#data
Data Management Platform
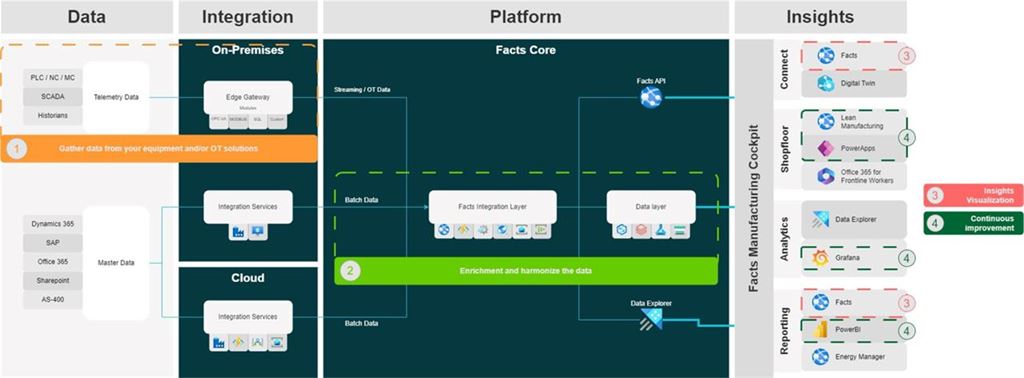
Data Management Platform provides a connectivity layer, data standardization & contextualization, rules engine, data historian, data visualization, monitoring & alerting, visualization and data access of your telemetry, and master data.
The goal of the solution is to lower the amount of device and infrastructure management in a scalable manner.
Key Features
- Connect to OT (Operational Technology) data:
- Data Management Platform brings together data that is not yet connected: from PLCs, devices, SCADA/MES, and more. Azure IoT Edge containers allow you to connect with a multitude of OT data sources, such as OPC UA, Modbus, SQL, files, APIs, LoraWan, IOLink…
- Device management:
- Simplify your incoming data streams by easily setting up your gateway devices.
- Quickly deploy edge modules allowing you to connect your on-premises data towards the cloud.
- Data mapping:
- Map your data from your gateway devices to your digital twins. A simple programmable interface allows you to filter, map and in/exclude data.
- Asset templating:
- Create asset templates to allow for quick deployment of hundreds of new assets.
- This will allow your team to define the capabilities, units of measurements, data types, mappings,… specific to the asset type.
- Create asset templates to allow for quick deployment of hundreds of new assets.
- Rules & calculations:
- Making calculations and sending events based on the incoming data streams is crucial for a modern IoT solution.
- An Excel-based interface allows everyone with Excel knowledge to work with the IoT data streams.
- Realtime & historical data:
- Analyze both real-time latest state information and historical data of multiple assets on the same dashboard with easy-to-use widgets.
- Build your own dashboards:
- Build multiple dashboards in a graphical, no-code way.
- Organization structure:
- Create the organizational structure that represents your factory setup, divisions, work area’s etc. in a flexible way and group assets and dashboards on different levels of the organization.
- Visual alerting:
- Use conditional formatting rules, labels and colors to create visual alerting rules based on the incoming data that will immediately draw your attention in the dashboard, in real time.
Virtual Appliance Image
Rolling out a software solution across multiple factories and multiple sites is no mean feat. That’s why Orise Digital developed a Virtual Appliance Image (VAI). The VAI is a deployment-ready Virtual Machine that makes it easier and faster for the customer to deploy Linux-based IoT Edge Devices at scale. Features of the VAI include:
- Automated provisioning: The VAI requires a number of fields to be filled out and then completely self-installs and provisions itself to Data Management Platform.
- LTS support for Azure IoT Edge: The VAI is based on the currently supported LTS version for Microsoft Azure IoT Edge.
- Virtualization platform independent: The VAI comes in the form of an OVA file with an embedded OVF which includes the main setup properties.
Data Management Platform’s architecture is built in such a way that extra functionality and extra modules can easily be added, allowing you to extend the solution with any new use case you discover.
#performance
Performance Monitor
- Real-Time Data Visualization: Displays live data from production lines, allowing operators and managers to monitor performance metrics as they occur.
- KPI Tracking: Tracks critical KPIs such as production output, cycle times, downtime, and overall equipment effectiveness (OEE).
- Custom Dashboards: Offers customizable dashboards that can be tailored to specific roles or operational needs, ensuring relevant data is always accessible.
- Reporting and Analysis: Provides tools for detailed analysis of historical data, helping to identify trends, inefficiencies, and opportunities for improvement.
#lean
Lean Shopfloor Manager
- Multi-factory:
- Apply lean manufacturing standards, dashboards and templates across your factories and divisions.
- The application allows you to build and manage the user experience centrally, while giving the freedom to individual factories to extend their dashboards.
- Customizable dashboards:
- Keep employees aligned by defining dashboard templates on a tenant level that are extendible by the users on a per dashboard basis.
- Provide a standardized view which they can enrich with their own applications or data.
- Data sources:
- Gather data into the application such as manual input or data from other sources which can then be used to integrate within a dashboard.
- Dashboard templating:
- Multiple widgets allow you and your users to create dashboards that are compelling and easy to use
- Choose from simple table widgets to embeddable applications and bring every process in your organization into a central panel

- Action management:
- Set up alerts and notifications when action criteria are met within your organization.
- Assigned users will be notified via email or other channels regarding the status of the alert.
- Follow up on actions using the inbuilt PDCA module.
#customer
Customer Performance Management Portal
- Order Tracking: Allows customers to track the status of their orders in real-time, from production to delivery.
- Communication Hub: Provides a central platform for communication between customers and service teams, facilitating quicker resolution of issues and queries.
- Document Access: Customers can access important documents such as invoices, product specifications, and compliance certificates directly through the portal.
- Customizable Interface: The portal can be customized to meet the specific needs of different customers, providing a tailored experience that enhances customer satisfaction.
#managed-services
Managed Services
Orise Digital can help you throughout your IoT and Cloud projects, from whiteboarding the project to keeping your implementation in shipshape with our managed services offering. By letting us handle the technical aspects, you can focus on developing your own business.
What we offer in managed services:
- Cloud support services: SLA-based 2nd and 3rd line support to keep your end users and business moving 24/7. We offer these services for our products and for custom development.
- Platform support services: Technical proactive and reactive support services to manage the platform for you. We offer these services for Orise Digital solutions and for custom development.
- Orise Digital software support: Stay up to date with new software releases and product fixes.